It has been exactly one year since the most recent the Oregon Progress Board released the Oregon Benchmarks report, which highlights the progress of Oregon's minority populations.
But what does this report really tell us about Oregon and how important is the data?
According to Sean Cruz, chief of staff for Oregon Sen. Avel Gordly, D-N/NE Portland, the local senator frequently uses the state benchmarks to guide her decision-making.
"I can't say how others use it, but we use it," Cruz said. "We look at the data and see where we are as far as the benchmarks."
One recent example, Cruz said, can be found in Senate Bill 38, which would dedicate funding to a home ownership assistance account to help minority homebuyers.
"Educational achievement, dropout rates, civic involvement – those benchmarks are all in there and we do use them," Cruz said.
Another local politician, Rep. Chip Shields, D-inner N/NE Portland, says the Benchmark Report definitely gets used, but that the state agencies tend to use the data more often than individual legislators.
Shields cautioned though, that due to an under-funding of the Oregon Progress Board, which is charged with producing the report, the data "hasn't been maximized to the degree that it could be."
The most recent Benchmarks Report highlights the state's division by race in areas such as education, arrest rates, home ownership, health care and poverty.
According to the 2006 report, Oregon is getting more diverse, but remains less diverse than the United States as a whole.
"African Americans are the least represented (in Oregon), being about eight times less likely to live in Oregon," the report states. "Only American Indians are more likely to live in Oregon than in other states, on average."
In addition, even though the state experienced a dramatic increase in the number of Hispanic residents over the past decade, according to the report, "the overall percentage of the population that was Hispanic in 2004 (9.6 percent) remained lower in Oregon than in the U.S. overall (14.2 percent)."
What else does the report tell us about our state and about the state of Oregon's African American population?
• Overall, the status of Oregon's Black community was negative regarding education; mixed when it came to health and safety; and mixed regarding financial status.
• The adult high completion rate for Blacks improved from 1990-2004 and was "better than all other diverse groups in Oregon and African Americans nationwide."
• Home ownership for African Americans was lower than all other diverse groups except Hispanics, and fell more than 40 percent below the statewide average in 2004.
• Although the high school dropout rate for Black students improved from 2000 through the 2003-04 school year, the rate is still worse than all Oregon groups except Hispanics.
• Prenatal care increased more for African Americans than any other group from 1990 to 2003, but remained below the state average and below Oregon's target benchmarks.
• African Americans in Oregon fare better than their national counterparts in terms of poverty; but the rate of Blacks living in poverty in this state is still more than twice the targeted levels for 2005 and is worse than every other group except Hispanics.
• As of 2004, Oregon consists of 87.4 percent Whites; 1.7 percent African Americans; 1 percent American Indians; 3.8 percent Asian or Pacific Islanders; 2.9 percent of people defined themselves as "multi-racial" and 3.2 percent considered themselves part of the "other" category.
• The high school completion rates for African Americans and for Asian/Pacific Islanders are close (within 2.5 percentage points) to that of Whites.
• African Americans were the only group in Oregon that exceeded their national counterparts in terms of college completion (20.8 percent in Oregon versus 17.3 percent nationwide).
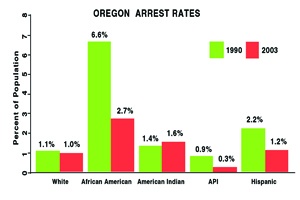
• African Americans continue to have the highest arrest rates when compared to every other population group in Oregon. In 2003, the arrest rate for African Americans was 2.7 percent, compared to 1.6 percent for American Indians, 1.2 percent for Hispanics, 1 percent for Whites and 0.3 percent for Asians/Pacific Islanders.
For more information, to see the complete report or to find out which agencies are using the benchmarks in their policy-making decisions, visit www.oregon.gov/DAS/OPB.


 (Mike Norris)")


")


")


 with Family Care Health sponsor Larmar Tillman (left) (Mike Norris)")


, U.S. Sentor Jeff Merkley of Oregon (middle) and Jasmine S. Streeter (right) at the 31st MLK Breakfast, Portland, Jan. 16, 2017 (Antonio Harris)")


 (Mike Norris)")


")


")


 with Family Care Health sponsor Larmar Tillman (left) (Mike Norris)")


, U.S. Sentor Jeff Merkley of Oregon (middle) and Jasmine S. Streeter (right) at the 31st MLK Breakfast, Portland, Jan. 16, 2017 (Antonio Harris)")


